
Analyzing a WordPress plugin competitor means reading it on a fixed scorecard of specific signals - not just downloads, but estimated installs, growth rate, momentum, rank, ratings, version distribution, release activity, WP.org search position, technical requirements, and product positioning - so every competitor you track gets compared on the same terms instead of a different glance each time - the same scorecard works for a theme competitor, not just a plugin one.
That's a different job from niche research, which sizes a whole category, and plugin research, which validates one idea. This is the profile you build on the specific competitors you've already named, and re-run on a cadence.
Every one of the eleven signals below already lives on a StatWP plugin page, and the compare tool lines several competitors up at once - more on exactly where to find both together at the end. What follows is what each signal actually means once you're looking at it.
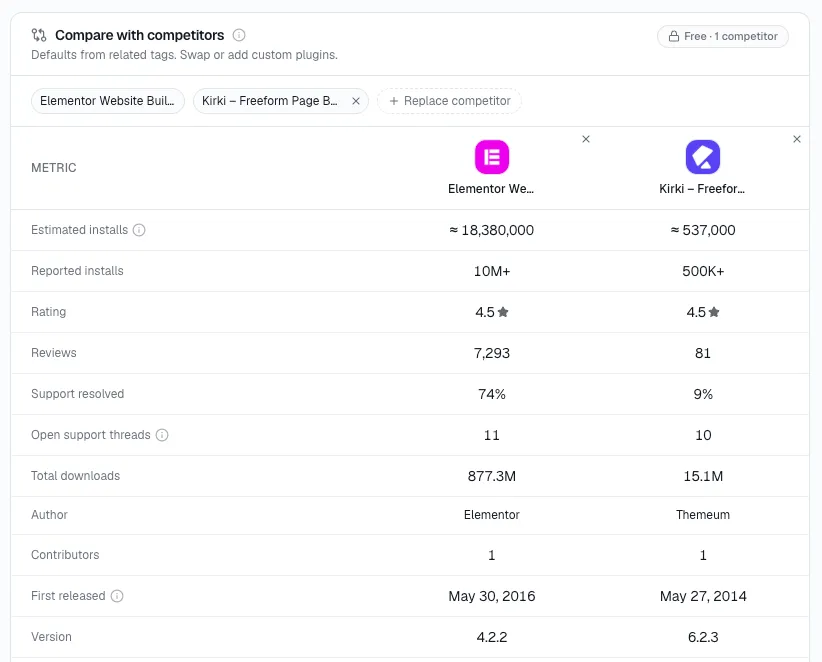
Fast answer: analyze a WordPress plugin competitor by scoring it against the same fixed set of signals every time - installs, growth, momentum, rank, ratings, releases, and positioning - not just its download count, so every competitor you track gets compared on identical terms.
Eleven signals, one scorecard: here's what each one actually tells you
Estimated installs. The size of their current user base - a scale number. It tells you how big they are right now and nothing about which direction that's heading, which is what the next signal is for.
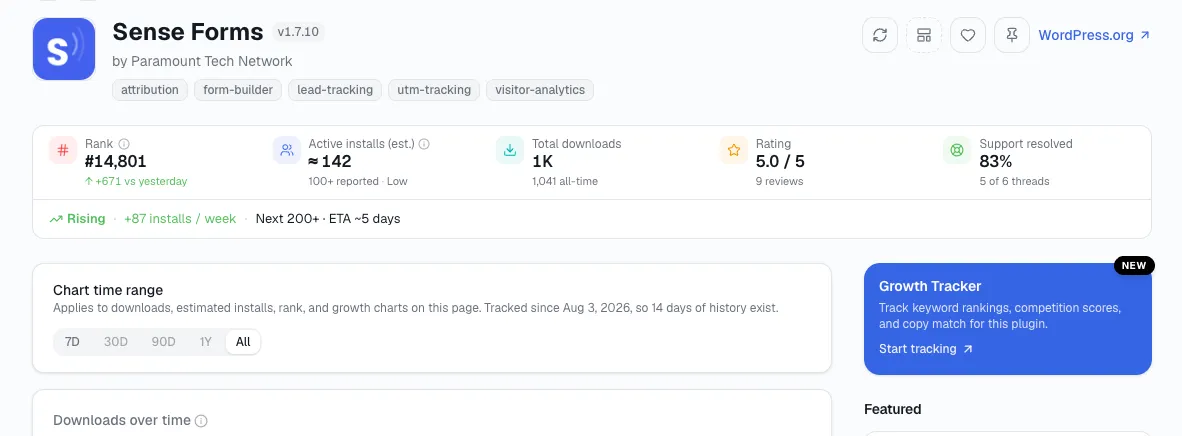
Growth %. The rate their install base is changing over a recent period. My sense of it: a competitor with fewer installs but positive growth is a more urgent threat than a bigger one that's flat, because growth is the number that predicts where the gap between you closes or widens next.
Momentum. Whether that growth rate itself is speeding up or slowing down. Two competitors can show the same Growth % this month and mean opposite things - one accelerating into it, one decelerating out of a stronger period - and momentum is the signal that tells those two apart.
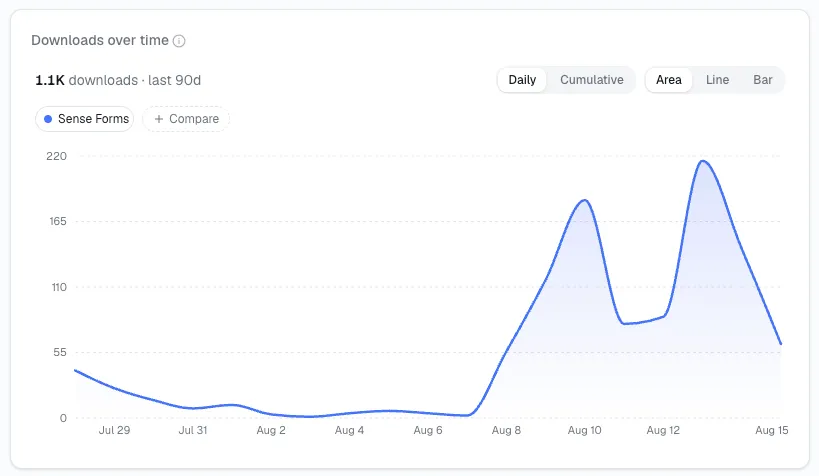
Downloads over time. The shape of their entire adoption curve, not just the current period. I read a competitor whose downloads peaked two years ago and have tapered since as fundamentally different from one on a steady upward curve, even if today's numbers happen to look similar.
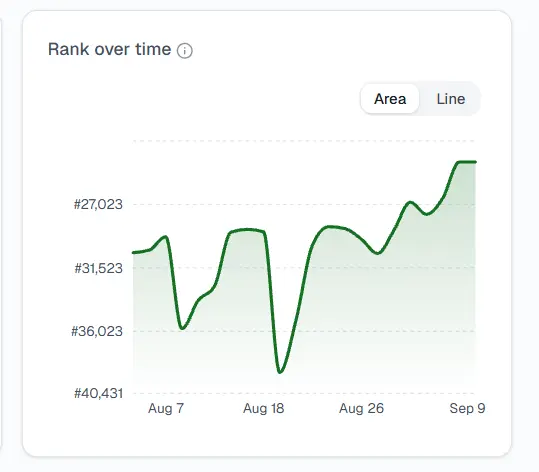
Rank. Their overall standing in WordPress.org's own popularity ordering. It's a single number you can check at a glance for general visibility - but it doesn't tell you whether that visibility is coming from the specific search terms that actually matter to your category, which is a separate signal below.
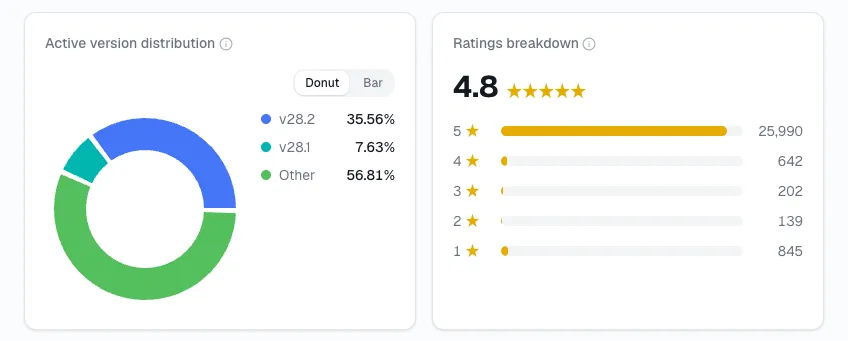
Ratings. The average and the underlying distribution, read together with how recently reviews have been landing. This is how I'd frame it: a high average built mostly from reviews left years ago is a different situation than the same average built from reviews landing this month - the number alone doesn't tell you which. Ratings and installs are the two numbers most people check first and stop there; comparing plugins beyond just ratings and installs is what the rest of this scorecard is for.
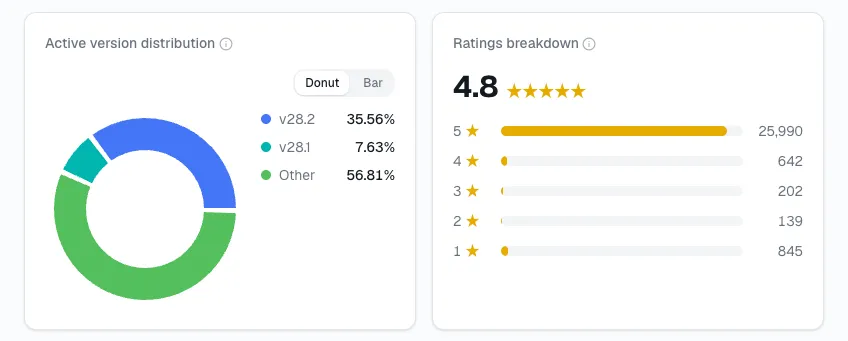
Version distribution. How their existing installs are spread across their own version history. I read a competitor whose base has mostly moved to the latest version as upgrading fast and easier to disrupt with a new feature, since users are already primed to update; one stuck on old versions, I'd call carrying baggage that slows it down.
Release activity. The changelog itself, read for content, not just date - security patch, bug fix, or real new feature. The same "updated recently" status can mean active investment or a team that only responds to security reports.
WP.org SEO ranking. Specifically where they sit in WordPress.org's own search results for the terms buyers in your category actually type - a different, narrower thing than the general Rank signal above, and the one that tells you how much of their growth is coming from organic directory discovery.
Requirements. Requires WP, Requires PHP, and Tested up to. These set a real ceiling on their reach - how much of the installed WordPress base can technically run their plugin at all - and show how up to date they are about compatibility.
Product positioning. The actual promise on their listing and their own marketing, in their own words. This is the only signal on the list that isn't a number, and it's what the other ten don't cover: who they're chasing and how they're telling their own story. Studying that positioning closely in a plugin that's clearly winning is its own exercise - see what a specific successful plugin's choices can actually teach you beyond what this scorecard checks off.
Turn all eleven signals into one sentence
Once all eleven are filled in for a competitor, write one sentence: “A user would switch from [competitor] to us if we ___.” If you can't finish that sentence, I'd still call the scorecard complete - you just don't have a wedge against that competitor yet, which is a real, useful finding on its own, and a reason to keep watching rather than a reason to stop. That sentence usually falls out of a qualitative pass over where a competitor's actual strengths and weaknesses sit, since the eleven signals explain how they're doing but not why.
How often you actually need to check back in
How often you need to look again depends on the signal:
Installs, growth, momentum, and rank - recheck monthly for your top 3-5 tracked competitors. These move the fastest and are cheap to glance at.
The full eleven-signal scorecard - re-run quarterly, or immediately after a competitor ships a major version or you notice a shift in their WP.org search position.
Rank and WP.org search position specifically - worth watching on their own dedicated cadence - see how to monitor changes in a competitor's plugin ranking as they happen instead of catching them only at the quarterly re-run.
Four ways people misread this scorecard
Reading Rank without Growth %. I read a high rank with negative growth as a competitor coasting on past momentum, not a currently strong one - the two signals answer different questions and neither substitutes for the other.
Trusting the ratings average without checking recency. An old, static average tells you about a competitor's past, not its present.
Ignoring Requirements when sizing a threat. I'd call a competitor requiring a recent PHP version smaller in addressable base than its install count alone suggests - and vice versa for one still supporting old environments.
Skipping product positioning because it's not a number. The other ten numbers tell you how a competitor is doing. Positioning tells you why, and it's the one signal that explains what a competitor would need to see from you before switching.
Questions that come up a lot
Do I need all eleven signals for every competitor? For a first pass, yes - the scorecard's value is in comparing the same signals across every competitor you track, not in picking favorites. After the first pass, monthly rechecks can focus on the four fastest-moving ones.
What's the difference between Rank and WP.org SEO ranking? Rank is a single overall popularity standing. WP.org SEO ranking is their position for the specific search terms your category's buyers actually type - a competitor can be high on one and unremarkable on the other.
How many competitors should I track this way? Three to five, chosen as the plugins actually growing and taking installs in your category - a full scorecard on a handful of live competitors beats a shallow glance at ten.
Now run it on your own competitors
Open StatWP, search a competitor's name or slug - plugin or theme - and their overview card already carries all eleven fields from this scorecard - no tab-switching between WordPress.org, an SEO tool, and a spreadsheet required. Add a few more names on the compare tool and you get all of them side by side on the same scorecard at once. The same scorecard works just as well pointed at your own plugin - see how to benchmark your plugin against competitors on identical terms rather than eyeballing the comparison.