
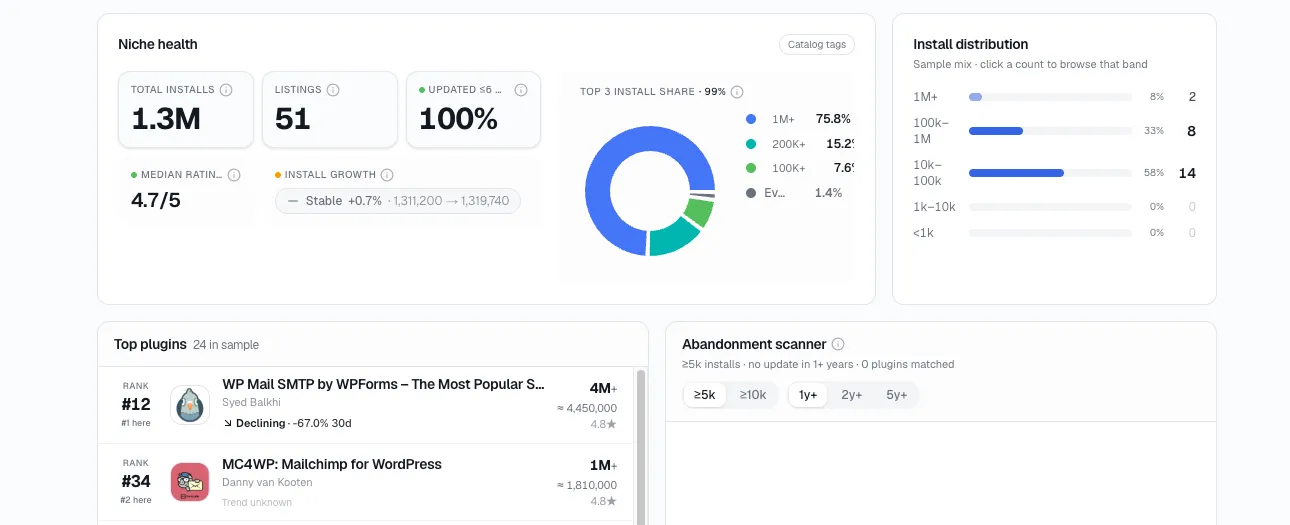
Analyzing a WordPress plugin niche's health means reading seven specific numbers together - how many tags define it, its total installs, how many listings compete in it, what share were updated recently, the median rating, install growth, and how concentrated installs are among the leaders. Each one alone answers a narrow question; only the combination answers the real one - is this niche actually worth entering.
I think of this as the full checkup, not the first thing to run. It's meant to come after a candidate has already cleared one or two of the narrower, single-signal screens covered elsewhere on this site - not instead of them.
Why this is the last step, not the first
Every one of the other niche-research posts on this site is a narrower test built around a single signal or a small combination of them:
Room to grow - one signal, install concentration ratio, checked alongside three supporting filters.
Underserved niches - listing count read against demand.
Saturation - a three-number combination of concentration, maintenance, and rating.
Each of those is fast and specific on purpose - built to screen a long list of candidates down to a shortlist quickly. This health check is what you run once a niche has survived that shortlisting: it pulls all seven numbers into one view so you can see how they interact, rather than checking three narrow questions and assuming the rest lines up.
I run it in that order because each step does what it's actually good at. The narrow screens are fast enough to run across a dozen candidates in an afternoon; the seven-number checkup takes longer to read properly, so it's worth reserving for the two or three niches that already look promising rather than running it first on everything.
The seven numbers, and what each one is actually for
Catalog tags. How many WordPress.org tags map onto the niche as you've defined it - the same logic applies whether you're scanning plugin tags or theme tags. Too few and you've probably drawn the boundary too narrow to see the real picture; too many and you're likely blending several distinct sub-niches into one number.
Total installs. The combined install base across every listing in the niche - the scale of demand, before you ask anything about how that demand is distributed or who's capturing it.
Listings. How many plugins actually compete in the niche. On its own, this number is close to meaningless — that's consistent with what I've watched happen. It only becomes useful next to the two metrics below.
Updated ≤6 months. The share of listings that have shipped an update recently. A niche where this share is low is being carried by whichever few listings are still active, regardless of how many total listings exist.
Median rating. The midpoint rating across the niche's listings - less distorted by one runaway five-star outlier than an average would be, and a better read on whether users are generally satisfied with what's available.
Install growth. The direction combined installs are moving over the trailing period. This is the one number that tells you whether the niche is expanding, flat, or contracting, independent of everything else on this list.
Top-3 install share. How concentrated installs are among the leading three listings. High concentration means the niche's demand has mostly already found its answer; low concentration means real room may still exist even in a niche with plenty of total installs.
A rubric for reading all seven at once
Use this as a rough scoring guide when you're looking at a niche's health view - not a strict formula, but a way to sort each number into "this looks healthy" versus "this needs a closer look" before you try to combine them:
| Number | Looks healthy | Worth a closer look |
|---|---|---|
| Catalog tags | Boundary matches how you'd actually compete | Very high (blended sub-niches) or very low (too narrow) |
| Total installs | Large enough that winning even a modest share matters | Too small to justify the build effort |
| Listings | Read only next to maintained share and concentration | Treated as a saturation signal on its own |
| Updated ≤6 months | Most of the niche, not just the top listings | Only the top 2-3 are current; the rest are stale |
| Median rating | Solidly positive across the category | Mediocre despite high concentration - users are stuck, not satisfied |
| Install growth | Trending up over the trailing months | Flat or declining, regardless of the other six |
| Top-3 install share | Low relative to the niche's size and maturity | High, especially combined with a high maintained share |
Why none of the seven work alone
High total installs with high top-3 concentration and a low maintained share describes a niche that looks big from a distance and is actually owned by two or three plugins that happen to still be active while the rest of the category quietly went stale. That's the saturation pattern covered in more depth in how to tell if a WordPress plugin niche is saturated.
Low total installs with even distribution and strong growth describes something else entirely - a small niche that's genuinely still forming. I've seen the same seven metrics, read individually versus read together, tell almost opposite stories. A third combination worth naming: high installs, low concentration, and strong growth together is the exact pattern finding niches with room to grow screens for - which is one reason that narrower check is worth running first, as a fast filter, before you commit the time to reading all seven numbers together here.
Where this gets checked in practice
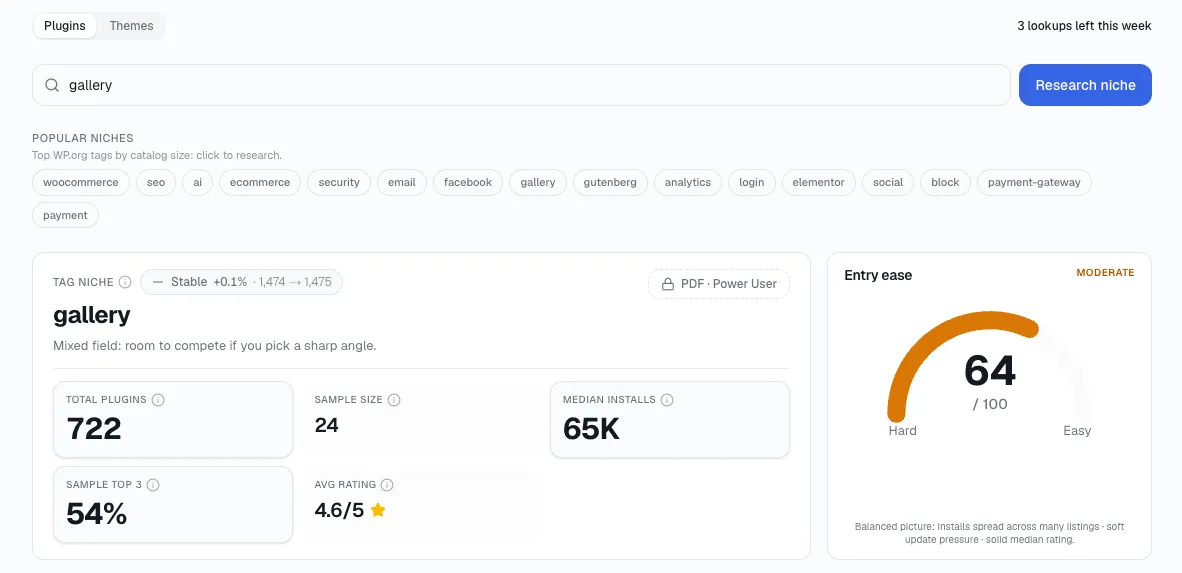
StatWP's Niche Research tool puts all seven of these on one niche health view for any plugin or theme tag or category, which is the entire point of tracking them as a set rather than pulling each one separately. Once a candidate has cleared this full check, the natural next step is the full niche-research process, which turns these numbers into an actual open, crowded, or shrinking call.
Compare a Niche's Seven Numbers
Questions about running the full checkup
Do I need to run all seven every time, on every candidate?
No - the narrower single-signal posts on this site are built for that first pass. Screen a longer list down with one of those first, then run the full seven-number checkup only on whatever survives - I've found that's the point where the extra detail actually earns its time.
What if the seven numbers point in different directions?
I read that as normal and worth sitting with rather than averaging away. A niche with strong growth but high concentration, for instance, is genuinely mixed - it might be a rising niche a leader already caught early, which is a different situation than one that's simply crowded.
How often should I re-run the full check on a niche I'm watching?
Numbers like growth and top-3 concentration can shift within a month or two; maintained share and median rating move more slowly. A monthly glance is enough for most candidates, in my experience - more frequent than that rarely changes the read.
Is this the same thing as the niche-research process?
The full niche-research process is broader - it includes defining the boundary, checking sub-niches, and accounting for demand outside WordPress.org. This health check is the specific numbers step inside that larger process, not a replacement for it.