
Telling whether a WordPress plugin is actually growing means checking the recent install trend, review velocity, and update cadence together - because the three numbers most people glance at first (total downloads, the current install count, and the star rating) can each look healthy while the plugin underneath them is flat or declining.
Open your plugin's (or theme's) page on StatWP and you'll see the 90-day install trend, review recency, and update cadence together already - so you're not left guessing at which of the three false signals below you're actually looking at.
View a Plugin's Real Growth Signals
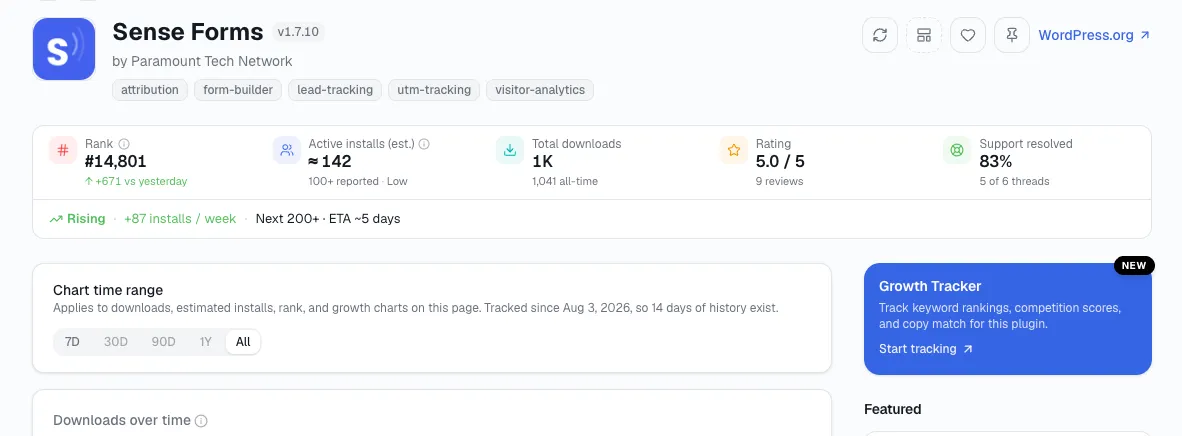
Quick Answer: To tell if a WordPress plugin is actually growing, check the recent install trend, review velocity, and update cadence together - total downloads, the current install count, and the star rating can each look healthy while the plugin underneath is flat or declining.
Three numbers that look like growth and aren't
"Downloads keep climbing"
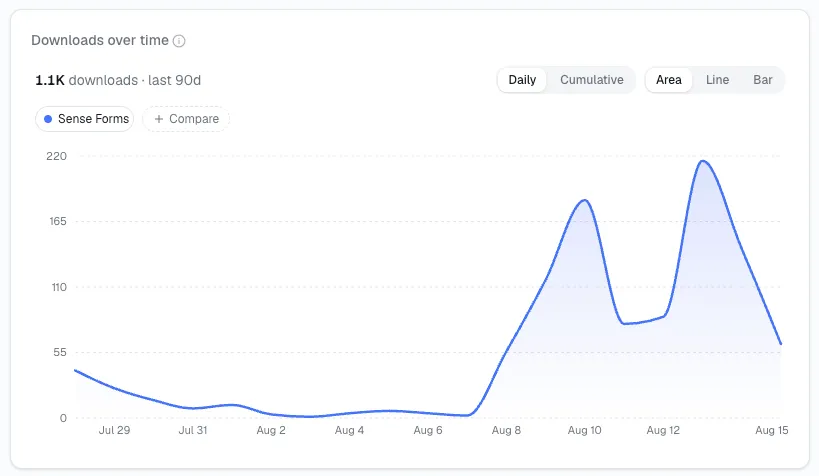
Total downloads never subtracts an uninstall, so it climbs even for a plugin losing active users every month. Active installs is the number that can actually fall - check that one instead, and check its trend over the trailing 90 days, not its current value.
Here's what that looks like with real-shaped numbers I run into constantly when I check a listing. A plugin installed 4,000 times over two years might show 50,000+ lifetime downloads on its listing - people who installed, uninstalled, and reinstalled during testing, agencies rolling it out across client sites and tearing it back down, users who abandoned it after a week. The download counter keeps every one of those events. Active installs only counts who still has it running right now.
"The install count looks solid"
WordPress.org rounds active-install counts - to the nearest 10 below 1,000 and the nearest 100 above it - so a specific-looking number is still a rounding bucket, not an exact count. Two plugins both showing "10,000+" could differ by a factor of several in reality.
Play that out the way I do it: a plugin sitting at 10,049 real active installs and a plugin sitting at 19,999 real active installs would both display as "10,000+" on their listing page. Read as a headline number, they look identical. They aren't, and the gap between them - nearly double - is exactly the kind of difference a single glance at the rounded figure will never show you.
"The rating is 4.7 stars"
A high average can be built almost entirely from reviews left a year or two ago, or inflated by in-plugin prompts that only fire for users who are already happy - a pattern our plugin research guide flags as one of the most common mistakes in reading plugin data. Check review velocity - how many reviews are landing per month right now - alongside the average, not instead of it.
I've seen two plugins both sit at 4.7 stars and land in completely different places. One earned that average from a dozen reviews trickling in every month, recent and current. The other earned it two years ago from a burst of reviews right after launch, and hasn't had a new one since. The star average treats both cases identically. Review velocity doesn't.
What to check instead
Look at three things together, not any one alone:
The 90-day active-install trend.
Review velocity over the last month.
Whether the "tested up to" tag is current.
A plugin passing all three is actually growing. A plugin passing only the first, with reviews long past and a stale compatibility tag, is coasting on a high point it reached a while ago.
The order matters too, and it's the order I use every time: check the install trend first, since it rules out the most common false alarm - a flat or declining trend on its own already tells you the plugin isn't growing, whatever downloads or the star rating suggest. Only once the trend looks genuinely positive is it worth spending time on review velocity and the compatibility tag, since those two are there to confirm a positive trend rather than to rescue a flat one.
A quick way to score any plugin you're checking
Here's the fast reference I use for reading the three checks above together, rather than one at a time:
| Pattern | What it usually means |
|---|---|
| All three current and moving up | Genuinely growing - the strongest read available |
| Install trend flat, reviews and updates current | Holding steady, still actively maintained - not growing, not dying |
| Install trend positive, reviews and updates stale | Likely coasting on an old high point rather than active momentum |
| All three flat or stale | A plugin that's effectively idle, whatever the headline numbers say |
Still Not Sure If It's Growing? Quick Answers
How far back should the 90-day install trend actually go before I trust it?
Ninety days is enough to smooth out a single unusual week - a blog mention, a compatibility scare - without going so far back that it hides a real, recent slowdown. Shorter windows are noisier; much longer ones can bury a recent change under old data.
What counts as good review velocity?
Good review velocity isn't one fixed number across categories - the comparison that actually matters, in my experience, is a plugin against its own recent history: reviews landing at a similar or increasing pace month over month reads very differently than a plugin that had a burst of reviews once and has gone quiet since.
Does a stale "tested up to" tag always mean the plugin is abandoned?
A stale "tested up to" tag doesn't always mean the plugin is abandoned, but I hold this as a real warning sign worth weighing alongside the other two checks - a plugin can go a few months without a compatibility bump and still be fine, but combined with a flat install trend and no recent reviews, it's usually the confirming signal rather than a coincidence.
Can a plugin look like it's declining by these checks and still be fine?
Yes - a mature, saturated-niche plugin can plateau at a stable, healthy install count with no real ceiling to keep climbing toward. A flat trend on a plugin that's already reached most of its addressable audience reads differently than the same flat trend on a plugin that's only a year old and should still be climbing.
Is there a StatWP view that shows all three checks side by side without checking each one separately?
Yes - a plugin's (or theme's) overview page on StatWP is built around exactly that, so you're reading install trend, review recency, and update cadence together on one screen instead of piecing them together from three different tabs.
Which of the three false signals trips people up most often?
Downloads, by a wide margin, in my experience. It's the number displayed most prominently on a plugin's own WordPress.org listing, and it's the one that never goes down, so it's the easiest to mistake for good news even when the plugin underneath it is losing active users every month.
What this matters for
This matters whether you're sizing up a competitor's plugin (or theme) or checking your own:
If it's your own, build a running log of these three signals rather than re-checking them from scratch each time.
If it's a candidate you're sizing up before building something similar, run it through the full validation process before deciding what its apparent success actually tells you.
Once you've confirmed a plugin is actually growing, whether that growth is accelerating or stalling is the next question - reading growth and momentum together is how you turn the two into one verdict.