
An underserved WordPress plugin niche is one where real demand exists but the number of listings competing for it is low - a mismatch between how much total install activity a niche supports and how few plugins (or themes; the same mismatch shows up there too) are actually built to capture it. That's a different question from whether the niche has room to grow.
This post is about spotting that mismatch specifically. For the concentration-ratio test - whether installs are locked up among the players that do exist, regardless of how many there are - see finding niches with room to grow.
The gist: a WordPress plugin niche is underserved when real install demand outpaces the number of listings competing for it — check the niche's install distribution, not just its plugin count, to find that gap.
Two niches, same listing count, side by side
Picture two niches that each show roughly 25 listings and similar combined installs. Laid out side by side, the difference isn't in the count - it's in how those installs are actually spread:
| Signal | Niche A | Niche B |
|---|---|---|
| Listings | ~25 | ~25 |
| Combined installs | Similar to Niche B | Similar to Niche A |
| Top-3 install share | ~85% | ~35% |
| What's actually happening | A small number of plugins already capture almost all demand | Installs spread across a dozen-plus listings, none dominant |
I'd call Niche A spoken for. Whatever's driving demand there has already been captured by a small number of plugins, and a new entrant is competing directly against entrenched leaders for the same users. I wouldn't automatically rule Niche A out, though - see how to find opportunities in a crowded WordPress plugin market for how to compete there anyway.
I'd call Niche B a different situation entirely. Real total demand exists, but no single plugin has captured it, which usually means users are actively trying several different options because none of them fully satisfies the need. That's what I'd call the shape of an underserved niche: real demand, spread thin, with nobody yet built specifically to answer it.
Why the listing count alone hides this
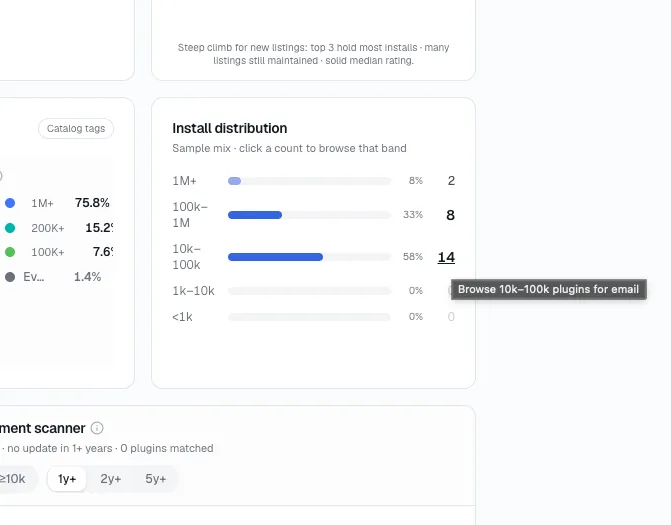
A raw listing count treats Niche A and Niche B as equally crowded, because it only counts how many plugins exist, not how installs are actually spread across them. I think that's the trap: "underserved" isn't about a low number of listings by itself - a niche with 5 listings and almost no total demand isn't underserved, it's just small. Distribution, not headcount, is what separates "already won" from "still open."
The listing count problem compounds when you're comparing niches side by side. Two categories both showing "25 listings" on a directory search look interchangeable until you check what's actually behind that number - one might be a mature category where 22 of those 25 are barely-installed clones of the same idea, while the other has 25 genuinely distinct approaches splitting real demand. The count tells you nothing about which is which; the distribution does.
What actually counts as demand here
Total combined installs across the niche is the first check - it's the same figure that shows up as the scale side of the health check in analyzing a niche's full health. A niche with 25 listings and 40,000 combined installs has a lot more real demand behind it than one with 25 listings and 4,000 - the listing count says nothing about which situation you're in.
Beyond the raw number, a few supporting checks help confirm demand is real rather than a fluke:
Combined installs are trending flat or up, not declining - a low concentration ratio in a shrinking niche just means nobody's fighting over a category people are leaving.
Median rating across the existing listings is mediocre-to-decent rather than uniformly poor - if every listing in a low-concentration niche is badly rated, users aren't spread thin because they're satisfied with variety, they're spread thin because nothing on offer actually works.
The listings that do exist are still maintained - an underserved-looking niche where most of the few plugins in it haven't shipped an update in years might be underserved because the category is dying, not because it's an open opportunity.
This isn't the "room to grow" test
It's easy to read these two questions as the same thing, and they aren't. Room to grow checks whether installs are locked up among the players that do exist - it's a concentration-ratio test, and it applies whether a niche has 8 listings or 80.
Underserved is about the listing side of the equation: does the demand support more competitors than currently exist. A niche can have room to grow (a low concentration ratio) while having plenty of listings, just none of them dominant - and a niche can be genuinely underserved (barely any listings exist relative to demand) while still showing a high concentration ratio, because the two or three plugins that do exist happen to have split a small install base evenly between them. Run both checks separately - passing one doesn't mean the other would pass too.
In practice, treat the two as complementary filters rather than a single combined score. I've picked this up over time: screening a shortlist of candidate niches for room to grow first, then checking which of those survivors are also underserved, narrows the list faster than trying to read both signals off one number.
Where to check this directly
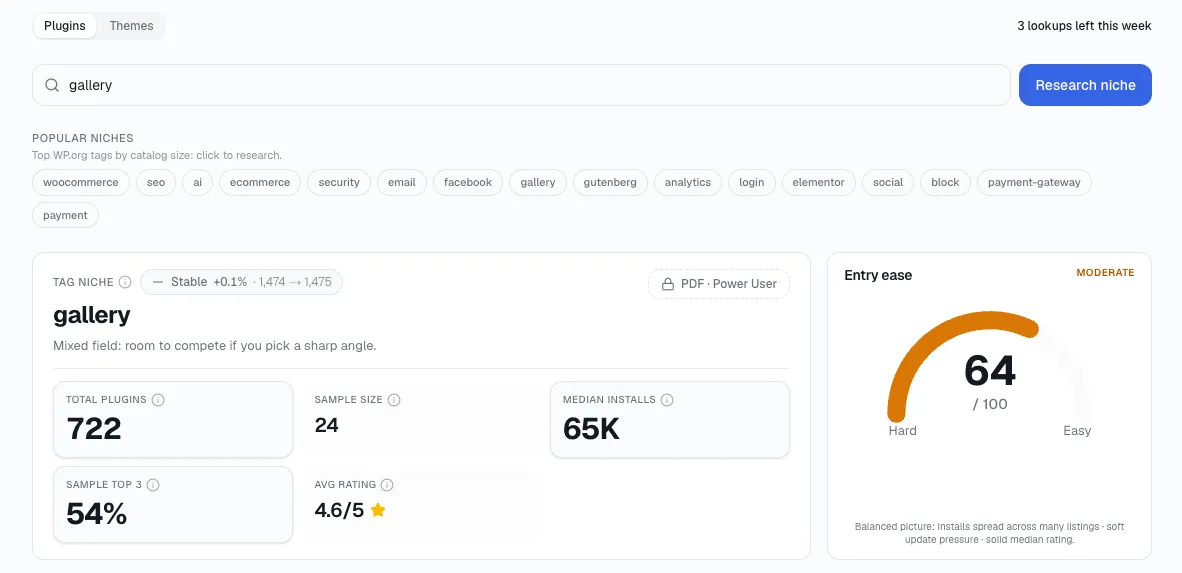
Open StatWP's Niche Research tool and pull up your niche - install distribution and top-3 install share sit right there for any tag or category, whether you're sizing up a plugin niche or a theme niche, instead of requiring you to total up install counts across a dozen open tabs. A niche with healthy total installs, a low listing count relative to that demand, and low top-3 concentration is worth sizing properly next, using the full niche-research process.
What "underserved" doesn't mean
Does a low listing count always mean a niche is underserved?
No. A niche can have few listings simply because few people want what it offers. Check combined installs first - a low listing count paired with low total demand is just a small niche, not an underserved one.
Is underserved the same as easy to enter?
No. It means the demand isn't already captured, not that the demand is large or that building for it is simple. Confirm the total install base is big enough to matter before treating "underserved" as a green light.
Can a niche be both underserved and saturated at the same time?
Not in the way this post defines it, but a niche can look underserved on listing count while its saturation numbers tell a different story - always check both rather than assuming a low listing count settles it.
How does StatWP help beyond the distribution chart?
Once a niche clears the distribution check on StatWP's Niche Research tool, that same tool also shows the growth, maintenance, and rating figures used in the demand checks in this guide, so you're not switching tools mid-screen.
What if two niches look identical on every number?
I see that happen more often than you'd expect at a glance, which is exactly why the Niche A vs. Niche B comparison earlier in this guide looks at distribution, not just totals. When the top-line numbers tie, top-3 install share is usually the number that actually breaks the tie between a niche worth entering and one that only looks that way.